Get vyoo, get viewed
Vyoo is redefining OOH advertising with unified tools for operations management, data measurement and analytics. Vyoo helps media owners, agencies, and advertisers plan, measure, and optimize campaigns effortlessly.
Make OOH Effortless
We are building India’s biggest integrated OOH platform, driven by first-party real time data collection.

VIDAR

ANALYTICS

INTELLIGENCE
OPTIMISE

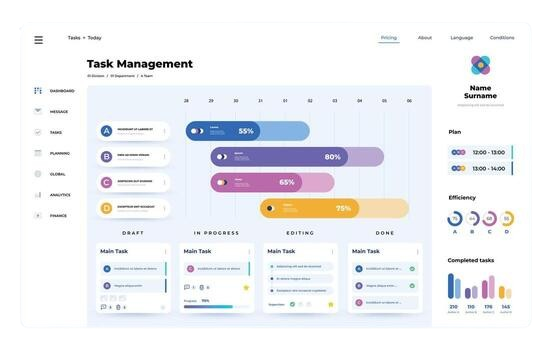
Enterprise Resource Planner
OOH Hub - ERP platform for media owners, advertisers, and agencies
Vyoo brings a unified ERP platform for Out-of-Home (OOH) media, combining campaign management, vendor coordination, billing, and performance analytics in one place. Whether you’re a media owner, advertiser, or agency, Vyoo’s tools help you plan, execute, and measure OOH campaigns effortlessly. Streamline your operations, reduce manual effort, and make every OOH decision data-driven.

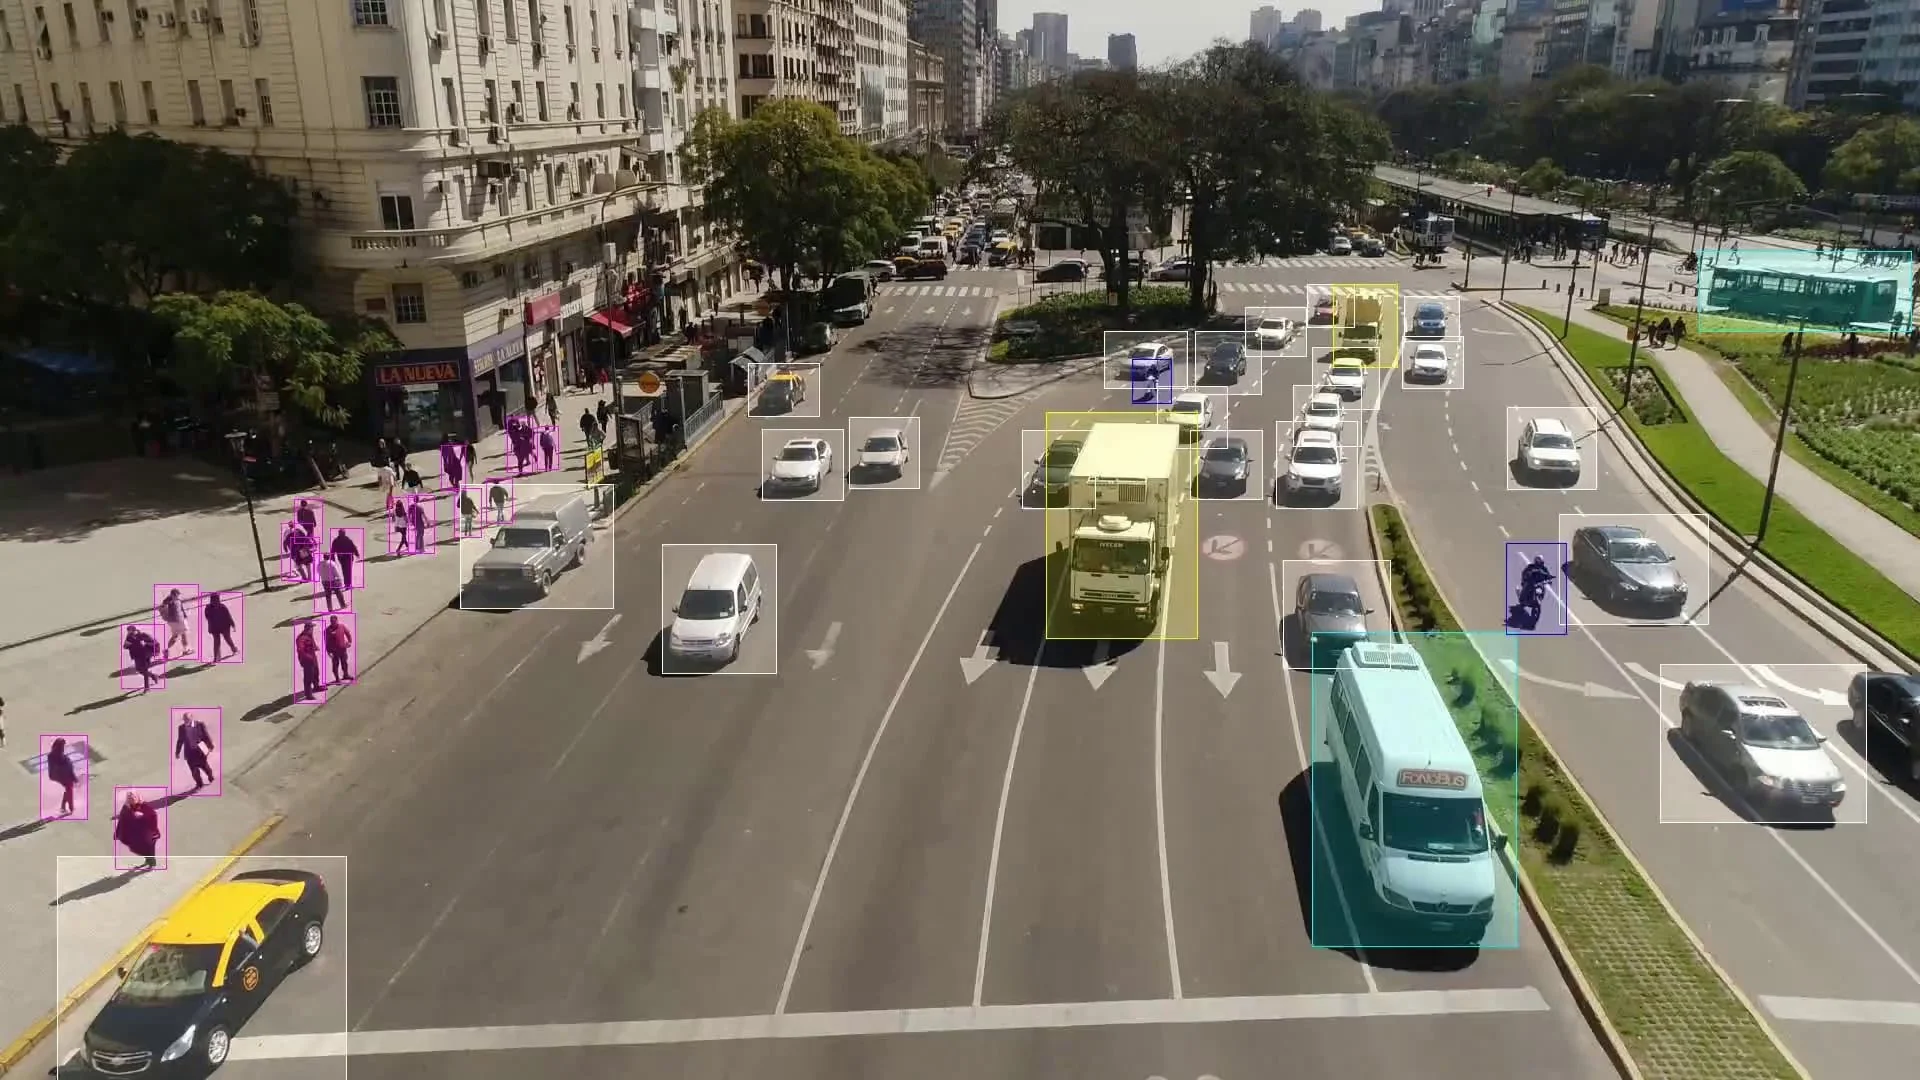
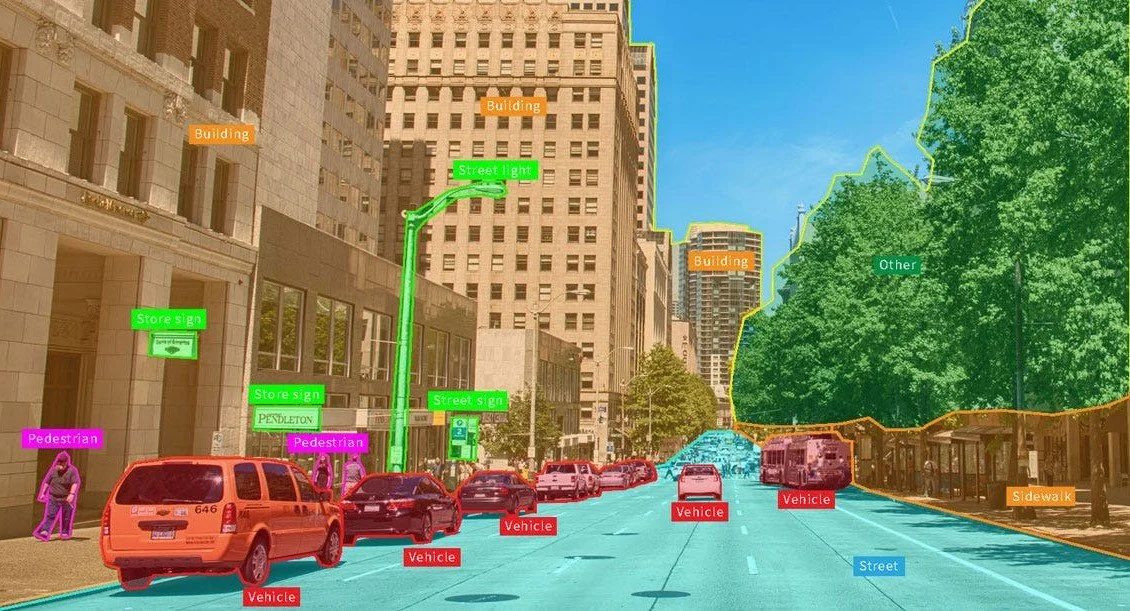
VIDAR
AI driven edge computing for detection and tracking
Vidar is our cutting edge AI-powered device, designed to revolutionise OOH media analytics. It leverages neural networks to detect and count impressions for your OOH media with extreme precision.
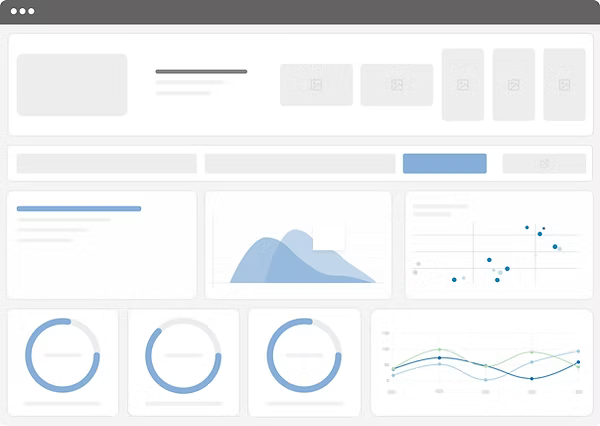

Access detailed, real-time analytics on a unified, user-friendly dashboard powered by Vyoo’s integrated ERP system. Track and optimise OOH media performance with impression histograms, time-lapse visualisations, competitor benchmarks, visibility scores, and audience heatmaps — all connected to your campaign, inventory, and billing workflows for complete operational insight.
ANALYTICS
Campaign reporting tools and measurement metrics
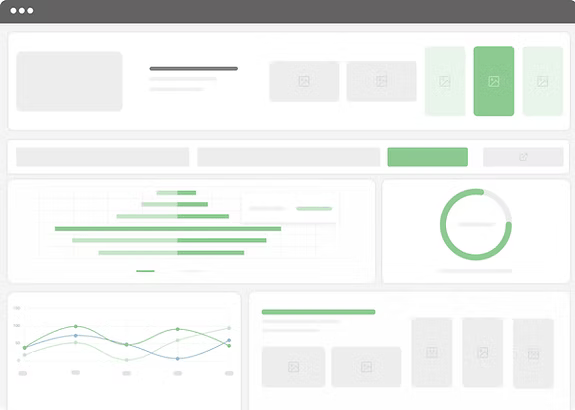


OPTIMISE
Optimise your OOH campaigns
Do not rely on guesstimations for your OOH decisions anymore. Access information regarding how every ₹ is being utilised. Optimise your campaigns on-the-go to maximise ROI. Reach and understand audiences like never before.

INTELLIGENCE
Deeper insights into your campaigns and spends
Leverage our advanced analytics tools to craft the perfect OOH campaign. Unlock the full potential of your marketing decisions with reach, impressions, dwell time, cost per impression and other actionable insights. The game of data is no longer the domain of online players.


Our Mission:
Vyoo’s mission is to bridge the data gap in the OOH industry with cutting-edge AI tech and advanced data analytics. We are working towards making the world’s oldest ad medium more reliable and effective and help you tap into its full potential.